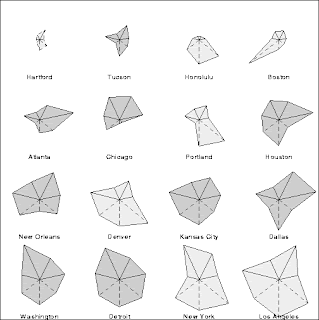
 This is a Star Plot of crime rates in U.S. cities. Each star represents an observation made and one ray is for each variable.
Sunday, December 7, 2008
Star Plot
 This is a Star Plot of crime rates in U.S. cities. Each star represents an observation made and one ray is for each variable.
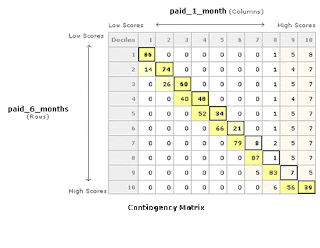
Correlation Matrix
 A Correlation Matrix shows correlation between two variables. The correlation matrix usually forms a diagnal from top to bottom.
www.intelligentresults.com/glossary.html
Similarity Matrix
Stem and Leaf Plot
Box Plot
Histogram

A Histogram is graphically shown as bars. Histograms can be arranged either horizontally or vertically.
Parallel Coordinate Graph
Subscribe to:
Comments (Atom)


