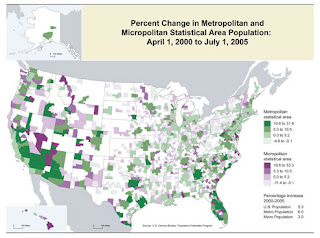
 This is a Statistical Map that shows the percent change in Metropolitain and Micropolitan Area Pollution from April 1, 2000 to July 1, 2000. This is an important map to become familair with and comfortable reading. It can help you learn about issues that surround us, such as pollution.
http://www.census.gov/popest/gallery/maps/map_20002005.jpg
No comments:
Post a Comment